Estimated that the odds ratio for lung cancer for a subject
1) Which of the following best describes the correct interpretation of a p value resulting from a statistical test?
A) The likelihood that your sample calculation captures the true population statistic
B) The likelihood that you will reject the alternative hypothesis
C) The probability of an event occurring given that the alternative hypothesis is true
D) The probability of an event occurring given that the null hypothesis is true
E) The probability that your conclusion is correct
2) The null and alternative hypothesis associated with the Pearson chi-square test is:
A) H0: Treatment is associated with response
Ha: Treatment is not associated with response
B) H0: Treatment is associated with improved response
Ha: Treatment is not associated with improved response
C) H0: There is no association between treatment and response
Ha: Treatment is associated with improved response
D) H0: Treatment is not associated with response
Ha: Treatment is associated with response
3) Consider the relationship between two continuous variables and the two-dimensional scatter plot associated with these variables. If the correlation coefficient is -1, then
A) All points lie in a straight line with a slope of -1
B) All points lie in a straight line with an unknown negative slope
C) All points do not lie in a straight line but the best fitting regression line has a slope of -1
D) There is a strong positive relationship between these two variables
4) In a study of the effect of smoking on lung cancer, it is estimated that the odds ratio for lung cancer for a subject that smokes relative to a subject that does not smoke is 2.6. This means:
A) A person with lung cancer is 2.6 times as likely to be a smoker as a non-smoker
B) A person that smokes is 2.6 times as likely to develop lung cancer as a person that does not smoke
C) A person that smokes has a 2.6% higher chance of developing lung cancer than a person that does not smoke
D) Lung cancer increases the prevalence of smoking by 2.6%
5) Which of the following is not a correct way to state a null hypothesis?
A) H0: p^1– p^2 = 0
B) H0: µ1 – µ2 = 0
C) H0: µ=10
D) H0: p = 0.5
6) A researcher is considering conducting a Chi-square test but is concerned because the observed counts are all less than 10. Which statement below would best address the researchers concerns?
A) Observed counts must be above 5 for a Chi-square test
B) Expected counts must be above 5 for a Chi-square test
C) The Chi-square test is nonparametric and so is appropriate for small counts
D) As long as the sample was random, the count size does not matter
7) Consider the following multiple regression model for a response variable of total cholesterol (mg/dL) with explanatory variables of smoker (0=no, 1=yes), married (0=no, 1=yes). and doughnuts (number consumed per week). What is the predicted cholesterol for a married nonsmoker who eats 7 doughnuts per week?
y^ = 196.5 + 4.6smoker – 7.2married + 1.2doughnuts
A) 195.1 mg/dL
B) 202.3 mg/dL
C) 190.5 mg/dL
D) 197.7 mg/dL
8) An observational study found a statistically significant relationship between regular consumption of tomato products (yes, no) and development of prostate cancer (yes, no), with lower risk for those consuming tomato products. Which of the following is a valid conclusion from this finding?
A. Something in tomato products causes lower risk of prostate cancer.
B. Based on this study, the relative risk of prostate cancer, for those who do not consume tomato products regularly compared with those who do, is greater than one.
C. If a new observational study were to be done using the same sample size and measuring the same variables, it would find the same relationship.
D. Prostate cancer can be prevented by eating the right diet.
9) A researcher collects data on 4 different personality types and their GRE scores. She would like to determine if the 4 groups have statistically different scores. She conducts a Levene’s test of variances and finds the p value of the test to be statistically significant at alpha = 0.05. Which of the following would be most appropriate for her next step?
A) Conclude that the variances are equal and conduct an ANOVA test
B) Conclude that the variances are not equal and use a nonparametric procedure to test for a difference in medians
C) Conclude that the variances are equal and conduct pairwise t test for each pair of groups
D) Conclude that the variances are not equal but use a Bonferroni procedure to account for the unequal variances
10) Consider the matched-pair data below. Calculate the odds ratio.
|
|
Case E+ |
Case E- |
|
Control E+ |
26 |
38 |
|
Control E- |
28 |
21 |
A. 0.74
B.0.49
C. 1.36
D. 1.95
11) Using the information from question 10, is there evidence that the odds ratio is significantly different from 1? Assume an alpha of 0.05.
A) Yes, because the confidence does not contain I
B) Yes, because the confidence interval contains 1
C) No. because the confidence interval does not contain I
D) No. because the confidence interval does contain I
E) Yes, because the OR is above 1
12) Which of the following is a criterion for choosing a t test rather than a z test when making an inference about the mean of a population?
A) The standard deviation of the population is unknown
B) The mean of the population is unknown
C) The sample may not have been a random sample
D) The population is not normally distributed
E) The sample size is less than 100
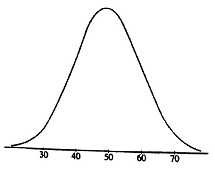
13) Which of the following is the best estimate of the standard deviation of the distribution shown in the figure below?

A) 5
B) 10
C) 30
D) 50
E) 60
